Value Based Payment (VBP) is a concept by which purchasers of health care (government, employers,…
The U.S. Nursing Shortage: A State-by-State Breakdown
Nursing has been an in-demand profession for years, with nearly every major hospital hiring for one of healthcare’s most important roles. In 2019, it ranked as the third-most in-demand job of any profession in the United States, and this trend shows no signs of slowing down.
As the baby-boom generation continues to age and overall population numbers increase, the demand for nurses continues to grow — especially in times of crisis like 2020’s COVID-19 outbreak. However, the gap between available jobs and people graduating nursing school continues to expand.
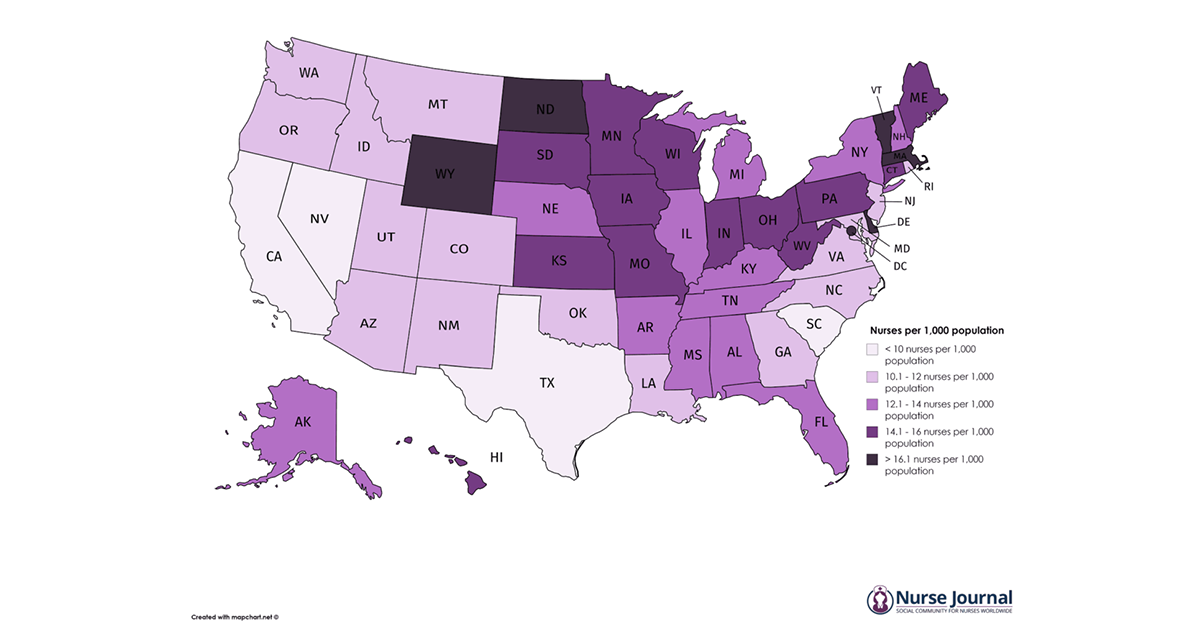
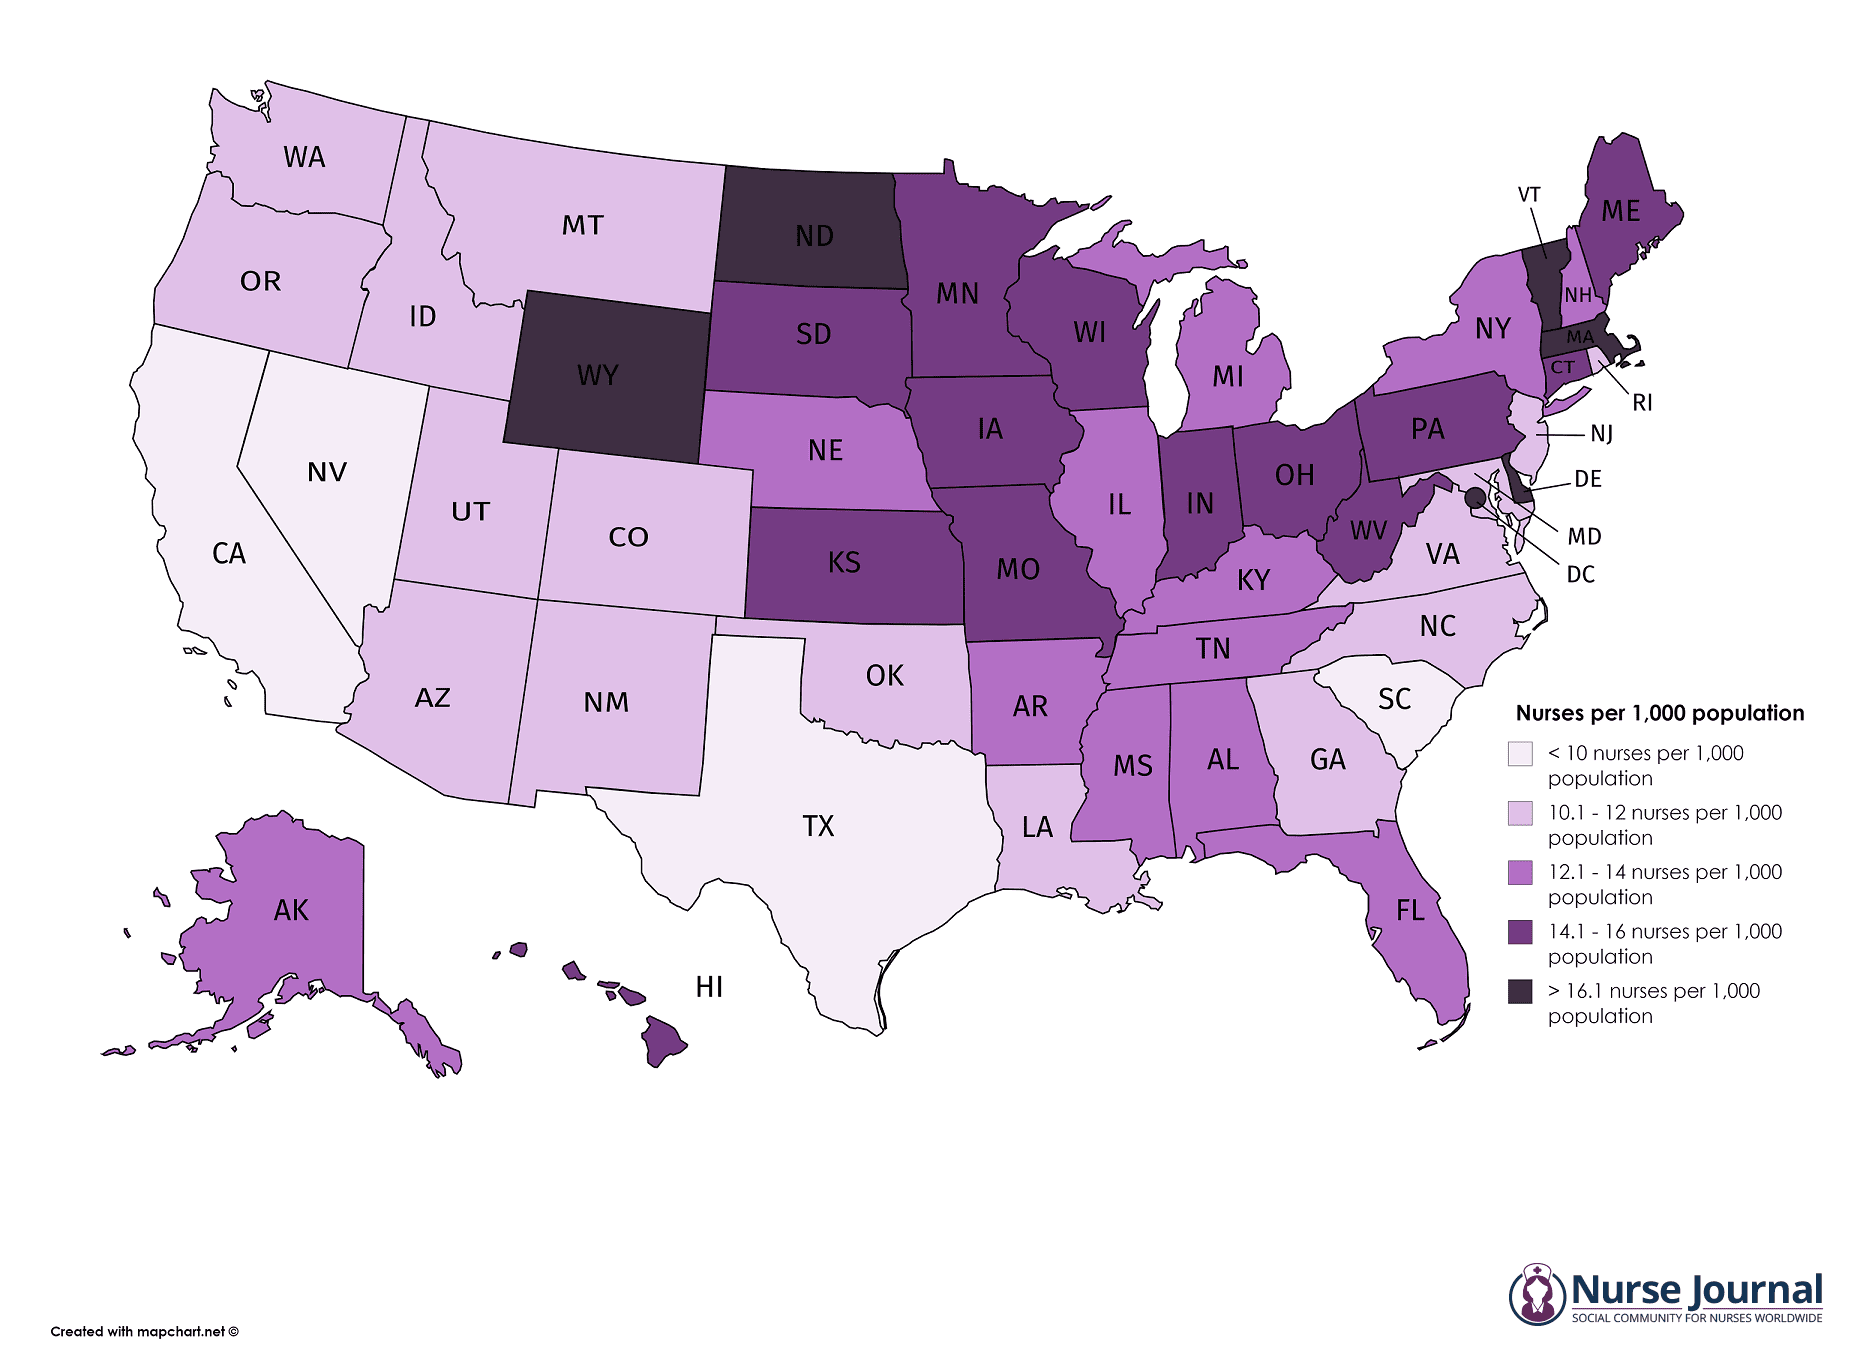
To best understand the shortage on a national scale, we gathered the most recent available data on the number of nurses in each state from the Bureau of Health Workforce database and compared it to state populations to illustrate the deficit on a state-by-state basis. The table below provides a ranking of states, starting with those with the lowest nurse-to-state population ratios.
| TOTAL NURSES (2018) | STATE POPULATION (2019) | NURSES PER 1,000 POPULATION | |
|---|---|---|---|
| USA total | 3,956,080 | 328,055,000 | 12.06 |
| South Carolina | 40,600 | 5,149,000 | 7.89 |
| Nevada | 28,400 | 3,080,000 | 9.22 |
| California | 365,500 | 39,512,000 | 9.25 |
| Texas | 279,000 | 28,996,000 | 9.62 |
| Georgia | 108,600 | 10,617,000 | 10.23 |
| Washington | 78,100 | 7,615,000 | 10.26 |
| Arizona | 75,600 | 7,279,000 | 10.39 |
| Rhode Island | 11,000 | 1,059,000 | 10.39 |
| Virginia | 89,800 | 8,536,000 | 10.52 |
| Idaho | 18,800 | 1,787,000 | 10.52 |
| Utah | 33,900 | 3,206,000 | 10.57 |
| Montana | 11,500 | 1,069,000 | 10.76 |
| New Jersey | 97,100 | 8,882,000 | 10.93 |
| Oregon | 46,500 | 4,218,000 | 11.02 |
| New Mexico | 23,200 | 2,097,000 | 11.06 |
| Oklahoma | 44,200 | 3,957,000 | 11.17 |
| Maryland | 68,300 | 6,046,000 | 11.3 |
| Colorado | 66,100 | 5,759,000 | 11.48 |
| North Carolina | 120,600 | 10,488,000 | 11.5 |
| Louisiana | 54,000 | 4,649,000 | 11.62 |
| Arkansas | 36,700 | 3,018,000 | 12.16 |
| New York | 238,300 | 19,454,000 | 12.25 |
| Illinois | 157,400 | 12,672,000 | 12.42 |
| Florida | 272,400 | 21,478,000 | 12.68 |
| Alabama | 62,700 | 4,903,000 | 12.79 |
| Nebraska | 25,000 | 1,934,000 | 12.93 |
| Tennessee | 92,000 | 6,833,000 | 13.46 |
| New Hampshire | 18,400 | 1,360,000 | 13.53 |
| Kentucky | 61,000 | 4,468,000 | 13.65 |
| Michigan | 137,500 | 9,987,000 | 13.77 |
| Mississippi | 41,300 | 2,976,000 | 13.88 |
| Alaska | 10,200 | 732,000 | 13.93 |
| Hawaii | 20,000 | 1,416,000 | 14.12 |
| South Dakota | 12,500 | 885,000 | 14.12 |
| Iowa | 46,180 | 3,155,000 | 14.64 |
| Kansas | 42,900 | 2,913,000 | 14.73 |
| Connecticut | 52,600 | 3,565,000 | 14.75 |
| West Virginia | 26,600 | 1,792,000 | 14.84 |
| Indiana | 97,200 | 6,484,000 | 14.99 |
| Pennsylvania | 193,200 | 12,802,000 | 15.09 |
| Missouri | 92,900 | 6,137,000 | 15.14 |
| Wisconsin | 88,500 | 5,822,000 | 15.2 |
| Ohio | 184,000 | 11,689,000 | 15.74 |
| Minnesota | 89,000 | 5,640,000 | 15.78 |
| Maine | 21,500 | 1,344,000 | 16 |
| Massachusetts | 111,500 | 6,950,000 | 16.04 |
| Delaware | 15,800 | 974,000 | 16.22 |
| North Dakota | 12,500 | 762,000 | 16.4 |
| Vermont | 11,000 | 624,000 | 17.63 |
| Washington DC | 13,000 | 706,000 | 18.41 |
| Wyoming | 11,500 | 579,000 | 19.86 |
![]() ADVERTISEMENT
ADVERTISEMENT
Are you ready to earn your online nursing degree?I WANT MY Select a degree Associate’sBachelor’sMaster’sDoctorateCertificate / DiplomaGraduate Certificates FOCUSING ON Select a subject Emergency ManagementFitness & Personal TrainingGerontologyHealth EducationHealth InformaticsHealth ScienceHealth ServicesHealthcare AdministrationHealthcare ManagementHuman ServicesLife Care ManagementNursing (RN required)Nutritional SciencesOccupational TherapyPublic HealthRN to BSN (RN required)Radiology TechnologyRegistered Nursing (RN)Respiratory TherapySpeech TherapySports Medicine SEARCH PROGRAMS
Major cities tend to perpetually need more nurses, with most city hospitals offering dozens if not hundreds of open positions. According to data from the Bureau of Labor Statistics, the following five states have the lowest local concentrations of nurse employment vs. national nurse employment:
- Washington D.C. (.67 location quotient)
- Dallas, Texas (.82 location quotient)
- Los Angeles, California (.88 location quotient)
- Houston, Texas (.88 location quotient)
- New York City, New York (.89 location quotient)
Mid-sized cities tend to maintain the highest location quotients of local nurse employment to national nurse employment:
- Greenville, North Carolina (2.25 location quotient)
- Ann Arbor, Michigan (2.05 location quotient)
- Sioux Falls, South Dakota (1.98 location quotient)
- Durham-Chapel Hill, North Carolina (1.95 location quotient)
- Gainesville, Florida (1.94 location quotient)
From the BLS data: The location quotient is the ratio of the area concentration of occupational employment to the national average concentration. A location quotient greater than one indicates the occupation has a higher share of employment than average, and a location quotient less than one indicates the occupation is less prevalent in the area than average.
Larger areas tend to suffer more from nursing shortages due to the population density of major metros. Simply put, there are not enough new nurses graduating nursing school to properly manage the volume of people who need any level of medical care within most large cities.
The American Association of Colleges of Nursing attributes the national shortage to four main reasons:
- Nursing school enrollment is not keeping pace with projected demand. Even though enrollment is up, it’s not keeping pace with the increase in need for nursing services.
- We lack the necessary number of nursing school faculty members. Without enough teachers, thousands of people interested in joining the nursing workforce are unable to do so without degrees.
- The rate of retirement for nurses is growing rapidly, as over half of the RN workforce is currently over 50 years old.
- An aging population in the United States continues to drive more demand than ever seen for nursing services.
Original Source: https://nursejournal.org/articles/the-us-nursing-shortage-state-by-state-breakdown/
Related Posts


This Post Has 0 Comments